January 23, 2017
With this years drought busting deluge of rainfall in Northern California, let’s consider why a visit to wine country might not be bad idea. Believe it or not wintertime can be one of the best times to look at real estate. Not because it is sunny and beautiful, not because it is warm and fuzzy, not for most of the reasons you come to wine country.
Weather Name Games
With names like Pineapple Express, Atmospheric Rivers, Cut-Off Low Pressure systems, Aleutian Storms… who wouldn’t want to check it out?! Most people visit wine country from March through October, when the weather is basically perfect. Not too hot, not too cold… just right… and essentially little to no rain. We all know it never rains in wine country. Right! It may have seemed that way the last several winters but in reality wine county gets rain, and sometimes lots of rain during the winter season. This year is a perfect example. Some local cities in Sonoma and Napa Counties have doubled the normal amount of rainfall for this time of year while already meeting or exceeding normal season totals. And we still have several months to go.
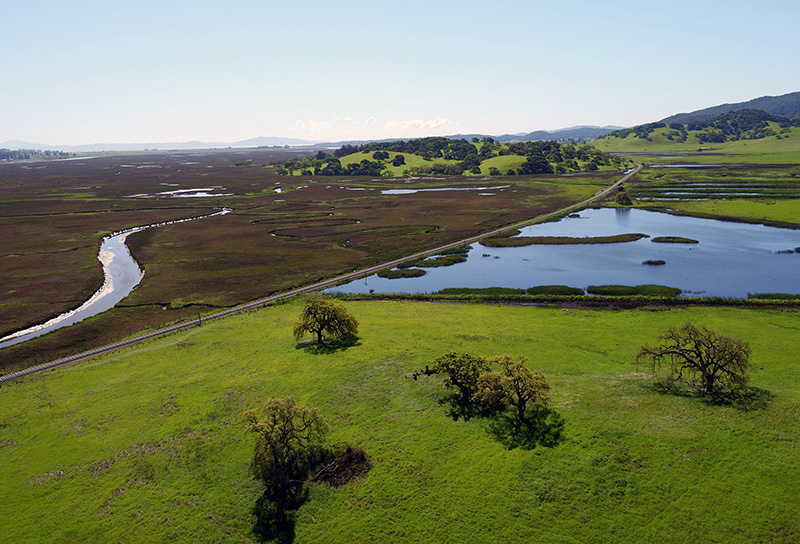
So you might be asking why would wintertime be a good time to look at real estate? The quick answer is the rain or more importantly, the run off. Many low-lying areas and trickling stream beds that look so inviting during the summer months can become wet, mushy and full of rapidly moving water during a severe wintertime storm. The landscape literally changes dramatically during these events. These changes can have a major impact on your property, or access to your property. Be on the lookout for a drought busting deluge. With that in mind, let’s take a look at our rainfall totals so far this season.
Rain Fall Amount In Inches
| Sonoma County | | | |
| City | July 1 to Jan 23 | July to Jan 23 Norm | Total Season Norm |
| Cloverdale | 44.17 | 23.47 | 43.94 |
| Healdsburg | 29.64 | 23.36 | 44.6 |
| Petaluma | 13.97 | 14.17 | 27.16 |
| Santa Rosa | 35.7 | 17.02 | 32.56 |
| Sonoma | 34.68 | 16.39 | 31.36 |
| | | |
| Napa County | | | |
| Napa | 20.17 | 15.53 | 27.88 |
| Saint Helena | 35.76 | 19.80 | 37.73 |
| | | |
Ref – Precipitation data for Select Bay Cities – SF Gate
Next Blog
Previous Blog
Some additional articles that might be helpful:
What is a vineyard really worth? It depends.
Wine Country Real Estate Building Blocks
Looking to Buy A Winery, Start Here
So where exactly is wine country?
Buying a Vineyard? A short course to the basics.
Which AVA came first?
If you are serious about your wine country search, please contact us today. Last but least, here is link to more local resources.